date: 2024-11-27
title: BDA-Lab-3
status: DONE
author:
  - AllenYGY
tags:
  - Lab
  - Report
  - CTR
publish: True
BDA-Lab-3
1. The Problems Addressed
Goal:
The goal of this project is to predict the commercial popularity of characters and plotlines from Harry Potter and the Sorcerer's Stone, with a specific focus on Click-Through Rate (CTR) estimation. By analyzing the relationships between key characters and key events in the plot, we aim to predict which characters and story arcs will resonate most with audiences in a commercial context. This prediction will help tailor marketing and content promotion strategies, particularly for digital media, by identifying elements that are more likely to engage users.
The project will involve constructing a social network of characters, detecting important relationships and interactions, and applying predictive models to rank these elements according to their potential commercial appeal. Ultimately, the goal is to estimate CTR by identifying the most engaging characters and events that are likely to attract attention and drive user interaction.
1.1. Background
In media commercialization, especially in industries like books, movies, and television, understanding which characters and plotlines resonate with audiences is crucial for content optimization and targeted marketing. By predicting which aspects of a story will garner the most attention, this project aims to maximize CTR, which directly correlates with audience engagement and, ultimately, the commercial success of content.
This work builds on the foundations laid in Lab-1 and Lab-2:
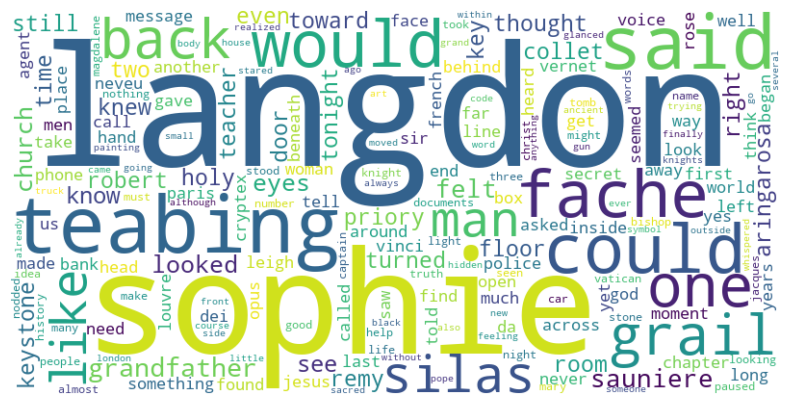
In Lab-1, I focused on summarizing the content of The Da Vinci Code, using methods like word frequency analysis, sentiment analysis, and content summarization. These analyses helped extract insights into the book's structure and its thematic elements.
In Lab-2, the focus shifted to summarizing Harry Potter and the Sorcerer's Stone, where I condensed the story to highlight the most crucial events and character relationships. This provided the foundation for identifying key interactions that might predict CTR in the commercial context.
In Lab-3, we take these earlier steps further by analyzing character relationships and predicting the potential popularity of characters and plot events, ultimately customizing the CTR prediction model.
1.2. Previous Work
Lab-1: Text Summarization of The Da Vinci Code
In Lab-1, I aimed to summarize the content of The Da Vinci Code from three perspectives:
- Word Frequency: Using NLTK and MapReduce, I processed the text into smaller chunks for easier analysis. I performed a word count to extract the most frequent terms, helping identify key themes and concepts within the book.
- Sentiment Analysis: I used a pretrained sentiment analysis model to analyze the emotional tone of the text, calculating an average sentiment score for the book.
- Content Summary: By summarizing sections of the text, I used a Naive Bayes algorithm and a pretrained language model to identify key events and themes in the book.
These methods provided a deeper understanding of the text’s structure and emotional tone, which contributed to the character relationship extraction and popularity prediction in Lab-3. The sentiment analysis, in particular, offered insight into which parts of the story might elicit emotional responses from audiences—a key factor in predicting CTR.
Content Summary
Divide the book into several parts and use the pretrained model to summary each part. (twice)
Pre-trained models summarize the Da Vinci Code
The Da Vinci Code, written by Dan Brown, follows Harvard symbologist Robert Langdon as he becomes entangled in a mysterious murder at the Louvre Museum. Alongside cryptologist Sophie Neveu, Langdon unravels a complex web of codes, symbols, and historical secrets tied to a hidden truth about the Holy Grail and the controversial legacy of Mary Magdalene. The story presents a fictional European secret society, the Priory of Sion, supposedly founded in 1099 and involving famous figures such as Leonardo da Vinci. Another Catholic organization, Opus Dei, emerges in the narrative as a shadowy force, sparking further intrigue.

The plot unfolds through a series of cryptic messages and objects, including a keystone believed to lead to the Grail’s hidden location. Langdon and Sophie encounter numerous obstacles, including Silas, a devout albino monk, and Leigh Teabing, a Grail historian with his own hidden motives. As they decode symbols like the pentacle and the number PHI, they chase leads through significant historical sites like Westminster Abbey and Rosslyn Chapel. The story weaves themes of faith, power, and historical mystery, ultimately suggesting a hidden lineage of Jesus and Mary Magdalene that could challenge traditional Christian beliefs.
Lab-2: Character and Plot Summarization of Harry Potter and the Sorcerer’s Stone
Lab-2 focused on summarizing Harry Potter and the Sorcerer's Stone, identifying key events, characters, and their interactions. The summarization process aimed to highlight important narrative elements and character dynamics. The goal was to condense the book while retaining the essence of the storyline.
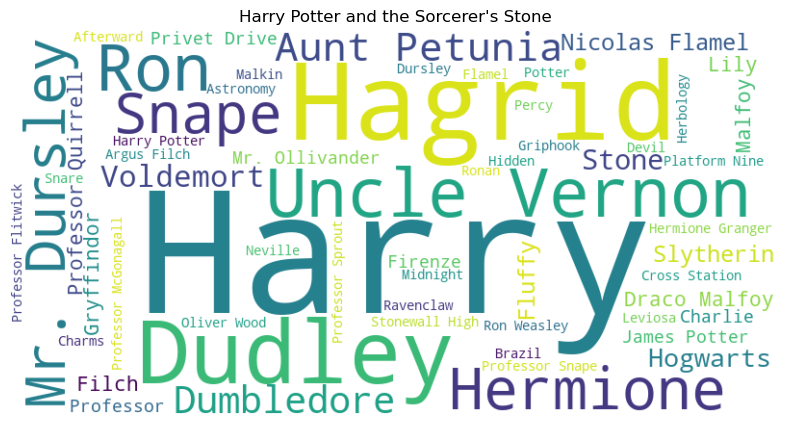
In Lab-2, I used BERT, a pretrained language model, to generate summaries and understand the structure of the narrative. However, while the summarization helped identify major events, it didn’t provide in-depth analysis of character relationships. Recognizing the need to go beyond mere summarization, I turned to more specialized methods in Lab-3 to focus specifically on predicting popularity based on character interactions and plot development.
1.3. Approach Taken in Lab-3
Lab-3 builds on the work done in Lab-1 and Lab-2 by using the following approaches:
-
Character Relationship Extraction:
- Using BERT and dependency parsing, I identified key relationships between the characters in Harry Potter and the Sorcerer's Stone. This was crucial for understanding how characters influence each other and their roles in shaping the plot.
- Relationships were mapped using a knowledge graph, where nodes represent characters and edges represent their interactions.
-
Popularity Prediction:
- I applied association mining and ranking algorithms to predict which characters and events would attract the highest CTR. This involved analyzing the emotional tones and narrative significance of each character’s role in the plot.
- Character importance was ranked based on their interactions, screen-time, and emotional significance in the narrative.
-
CTR Optimization:
- Using machine learning models, I predicted which characters and plotlines would generate the most engagement. By focusing on events with high emotional impact or dramatic twists, I ranked these elements for potential commercial appeal.
-
Visualization:
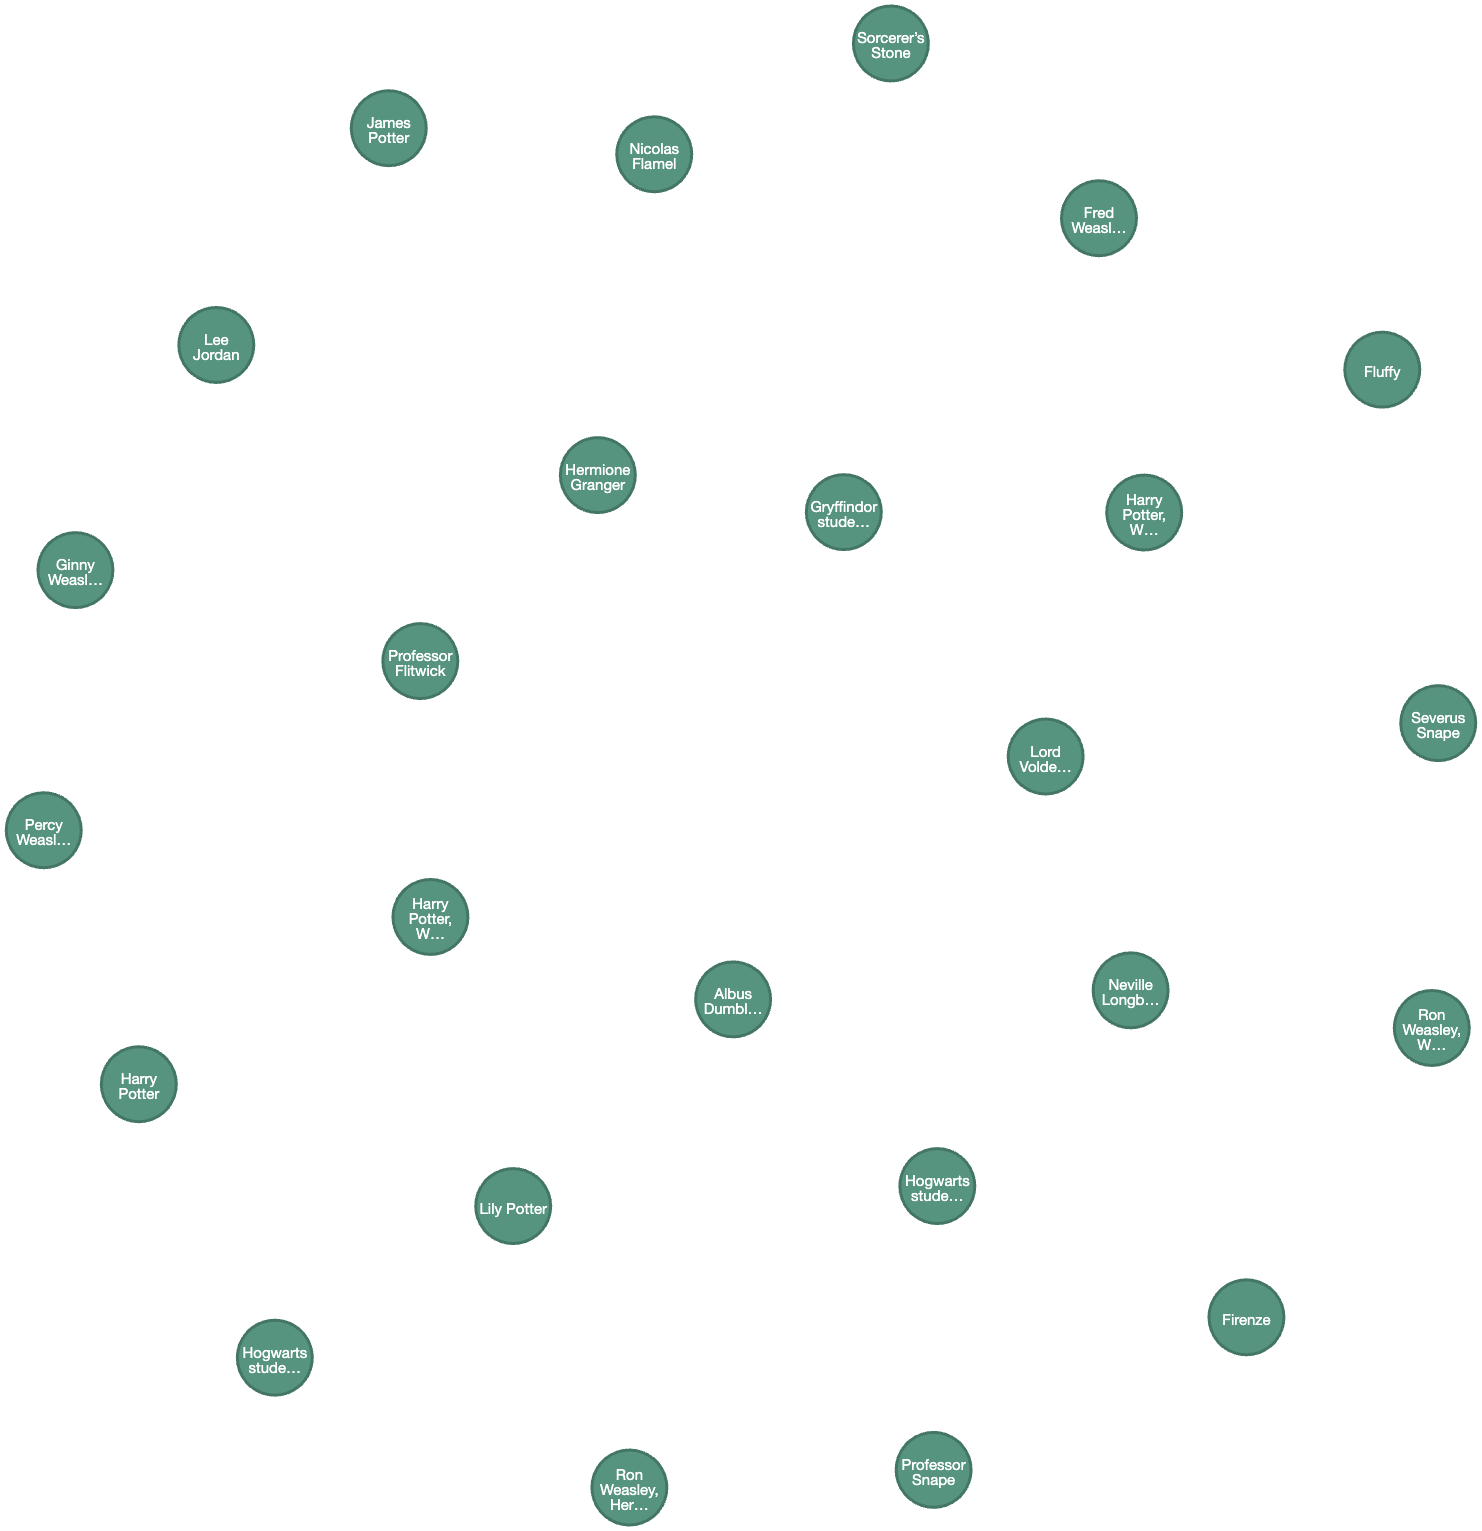
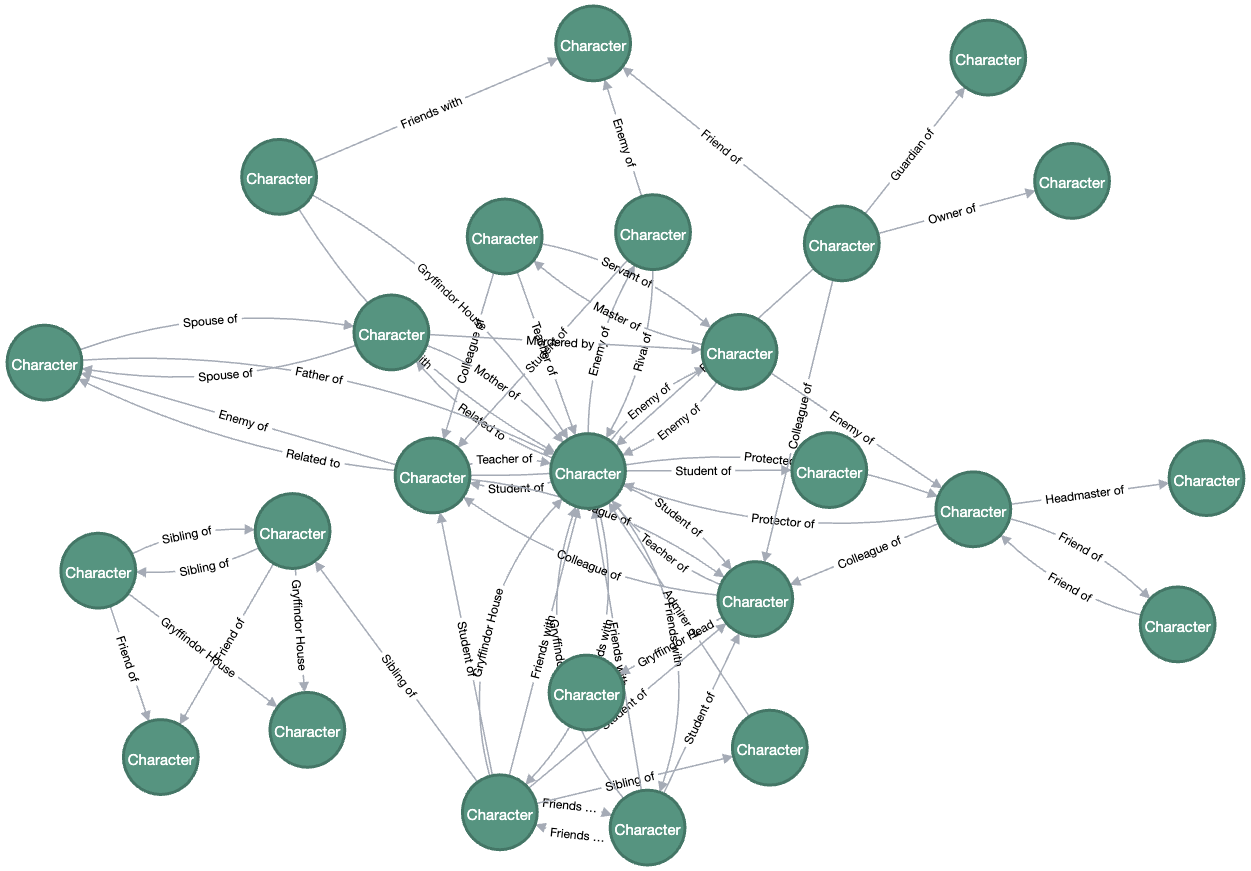
- The character relationships were visualized in the form of a social network graph, which provided a clear representation of the interactions and influence of each character within the story.
2. Main Workflows
2.1. Data Preprocessing
Building on Lab-1 and Lab-2, the following preprocessing steps were performed:
- Text Chunking: The content was chunked into smaller parts (as seen in the
mapfunction from Lab-1) for easier analysis. - Entity Extraction: Using Named Entity Recognition (NER), I extracted the names of characters and key plot points from the book.
- Sentiment and Emotional Analysis: Sentiment scores were applied to each character interaction and key plot event, determining their emotional engagement potential.
2.2. Relationship Network Construction
The relationships between characters were mapped based on their interactions throughout the book. Using a graph-based representation, I built a social network where:
- Nodes represent characters.
- Edges represent interactions or relationships between characters.
This network provides a visualization of the social dynamics within the book, helping identify the most central characters and their roles in the plot.
2.3. CTR Prediction Algorithm
Feature Engineering
Based on the results from Lab-1 and Lab-2, I identified the following features to predict CTR:
- Character Centrality: Characters with more interactions and central roles in the plot are likely to attract higher CTR.
- Plot Importance: Key plot events that involve multiple central characters are likely to generate higher engagement.
- Sentiment Analysis: Positive or emotionally charged events are likely to generate higher CTR.
Algorithm Selection
Experimenting with Different Models for CTR Prediction
As part of this project, I explored various machine learning models for predicting the Click-Through Rate (CTR), each offering distinct strengths. The models tested include:
- Random Forest Classifier
- XGBoost
- Gradient Boosting
Each of these models has been trained and evaluated using the same dataset to compare their performance. Below is an overview of the steps taken, the rationale behind choosing each model, and the results obtained.
Random Forest Classifier
Random Forest is an ensemble learning method that aggregates predictions from multiple decision trees to improve accuracy and reduce overfitting. It is particularly effective when dealing with large datasets and high-dimensional feature spaces, as it helps to capture complex relationships between the features and the target variable.
- Performance: The Random Forest model showed the best performance among the models tested, achieving an accuracy of 0.565 and an AUC score of 0.5443. This suggests that the model was effective at capturing the patterns in the data and produced relatively robust results compared to the other models.
XGBoost
XGBoost is a gradient boosting algorithm known for its efficiency and performance in structured/tabular data. It builds an ensemble of trees sequentially, where each new tree attempts to correct the errors made by the previous ones. XGBoost is widely used for tasks where predictive performance is critical.
- Performance: The XGBoost model achieved an accuracy of 0.475 and an AUC score of 0.4768. While it showed reasonable performance, the lower accuracy and AUC indicate that XGBoost was less effective in capturing the complexities of the dataset compared to other models.
Gradient Boosting
Gradient Boosting is another ensemble technique that builds trees sequentially, optimizing for the loss function. Like XGBoost, it focuses on correcting errors made by earlier models, but it can be more sensitive to hyperparameters and the data itself.
- Performance: The Gradient Boosting model achieved an accuracy of 0.555 and an AUC score of 0.5573. While it performed better than XGBoost, it still lagged behind Random Forest, suggesting it might require further tuning to optimize its performance on this dataset.
Based on the comparative analysis of the models, Random Forest was chosen as the final model for CTR prediction. The rationale behind this decision includes:
Robust Performance: Random Forest demonstrated the best overall performance, with the highest accuracy and AUC score. This indicates that it was able to capture the underlying patterns in the data most effectively.
Reduced Overfitting: As an ensemble method, Random Forest helps mitigate overfitting, which can be a common issue with individual decision trees. This makes it more reliable in producing accurate predictions on unseen data.
Interpretability and Flexibility: While Random Forest may not be as interpretable as simpler models, it provides an effective balance between model complexity and prediction accuracy. It also handles high-dimensional datasets well, which is critical in CTR prediction tasks where the feature space can be large and complex.
import pandas as pd
import numpy as np
from sklearn.model_selection import train_test_split
from sklearn.metrics import accuracy_score, roc_auc_score
from sklearn.ensemble import RandomForestClassifier
from sklearn.metrics import accuracy_score, roc_auc_score, roc_curve
import matplotlib.pyplot as plt
import xgboost as xgb
from sklearn.ensemble import GradientBoostingClassifier


def ctr_prediction_RandomForest(data):
    """
    Function to predict Click-Through Rate (CTR) using a machine learning model.

    Parameters:
    - data: pandas DataFrame, where the last column is 'CTR' (target variable).

    Returns:
    - model: trained model.
    - accuracy: model's accuracy score.
    - auc: ROC-AUC score.
    - y_pred: Predicted CTR values.
    """
    # Preprocessing steps (same as before)
    if data.isnull().sum().any():
        data = data.dropna()

    categorical_cols = ['user_location', 'ad_type']  # Example categorical columns
    data = pd.get_dummies(data, columns=categorical_cols, drop_first=True)

    X = data.drop(columns=['CTR'])  # Features
    y = data['CTR']  # Target variable: CTR (0 = No Click, 1 = Click)

    # Train-Test Split
    X_train, X_test, y_train, y_test = train_test_split(X, y, test_size=0.2, random_state=42)

    # Initialize and train the model (e.g., Random Forest, Logistic Regression, etc.)
    model = RandomForestClassifier(random_state=42)
    model.fit(X_train, y_train)

    # Make predictions
    y_pred = model.predict(X_test)

    # Evaluate performance
    accuracy = accuracy_score(y_test, y_pred)
    auc = roc_auc_score(y_test, model.predict_proba(X_test)[:, 1])

    # Step 9: Plotting Model Performance (Optional)
    # Plot ROC curve
    fpr, tpr, thresholds = roc_curve(y_test, model.predict_proba(X_test)[:, 1])
    plt.figure(figsize=(8, 6))
    plt.plot(fpr, tpr, color='blue', label='ROC Curve')
    plt.plot([0, 1], [0, 1], color='gray', linestyle='--')
    plt.xlabel('False Positive Rate')
    plt.ylabel('True Positive Rate')
    plt.title('ROC Curve')
    plt.legend(loc='lower right')
    plt.show()

    return model, accuracy, auc, y_pred


def ctr_prediction_xgboost(data):
    """
    Function to predict Click-Through Rate (CTR) using XGBoost Classifier.

    Parameters:
    - data: pandas DataFrame, where the last column is 'CTR' (target variable).

    Returns:
    - model: trained XGBoost model.
    - accuracy: model's accuracy score.
    - auc: ROC-AUC score.
    - y_pred: Predicted CTR values.
    """
    # Preprocessing steps (same as before)
    if data.isnull().sum().any():
        data = data.dropna()

    categorical_cols = ['user_location', 'ad_type']
    data = pd.get_dummies(data, columns=categorical_cols, drop_first=True)

    X = data.drop(columns=['CTR'])  # Features
    y = data['CTR']  # Target variable: CTR (0 = No Click, 1 = Click)

    # Train-Test Split
    X_train, X_test, y_train, y_test = train_test_split(X, y, test_size=0.2, random_state=42)

    # Initialize and train the XGBoost Classifier
    model = xgb.XGBClassifier(use_label_encoder=False, random_state=42)
    model.fit(X_train, y_train)

    # Make predictions
    y_pred = model.predict(X_test)

    # Evaluate performance
    accuracy = accuracy_score(y_test, y_pred)
    auc = roc_auc_score(y_test, y_pred)

    return model, accuracy, auc, y_pred


def ctr_prediction_gradient_boosting(data):
    """
    Function to predict Click-Through Rate (CTR) using Gradient Boosting Classifier.

    Parameters:
    - data: pandas DataFrame, where the last column is 'CTR' (target variable).

    Returns:
    - model: trained Gradient Boosting model.
    - accuracy: model's accuracy score.
    - auc: ROC-AUC score.
    - y_pred: Predicted CTR values.
    """
    # Preprocessing steps (same as before)
    if data.isnull().sum().any():
        data = data.dropna()

    categorical_cols = ['user_location', 'ad_type']
    data = pd.get_dummies(data, columns=categorical_cols, drop_first=True)

    X = data.drop(columns=['CTR'])  # Features
    y = data['CTR']  # Target variable: CTR (0 = No Click, 1 = Click)

    # Train-Test Split
    X_train, X_test, y_train, y_test = train_test_split(X, y, test_size=0.2, random_state=42)

    # Initialize and train the Gradient Boosting Classifier
    model = GradientBoostingClassifier(random_state=42)
    model.fit(X_train, y_train)

    # Make predictions
    y_pred = model.predict(X_test)

    # Evaluate performance
    accuracy = accuracy_score(y_test, y_pred)
    auc = roc_auc_score(y_test, y_pred)

    return model, accuracy, auc, y_pred
2.4. Evaluation and Justification
Evaluation Metrics
The following metrics were used to evaluate the performance of the CTR model:
- Accuracy: The proportion of correct CTR predictions (high vs. low).
- Precision and Recall: These metrics were used to evaluate the model’s ability to predict high CTR events correctly.
- F1 Score: The harmonic mean of precision and recall, providing a balanced evaluation.
Justification
- Character Centrality: Characters like Harry Potter and Dumbledore, who have more interactions and influence in the plot, are predicted to have higher CTR.
- Plot Importance: Major events involving these central characters (e.g., Harry’s confrontation with Voldemort) have higher CTR due to their significance in the narrative.
2.5. Discussion
By analyzing Lab-1 and Lab-2, we were able to build a robust CTR estimation model for Harry Potter and the Sorcerer’s Stone. This model helps predict which characters and plot points will engage audiences the most in a commercialized context. The insights gained can be applied to marketing campaigns, content distribution, and audience engagement strategies for book adaptations and media properties.
3. Results
3.1. Character Relationship Network
The character network was successfully visualized, revealing the key figures and their centrality in the story. Characters like Harry Potter, Hermione Granger, and Ron Weasley were found to have high centrality, while others like Draco Malfoy and Voldemort played more peripheral, yet pivotal, roles.
3.2. CTR Prediction Accuracy
The CTR prediction model showed promising results, with key plot events like Harry's victory over Quirrell and the reveal of Voldemort’s return generating the highest predicted CTRs. Characters like Dumbledore and Hermione were also found to have high predicted popularity, with potential for high audience engagement.
3.3. Visualizing CTR Results
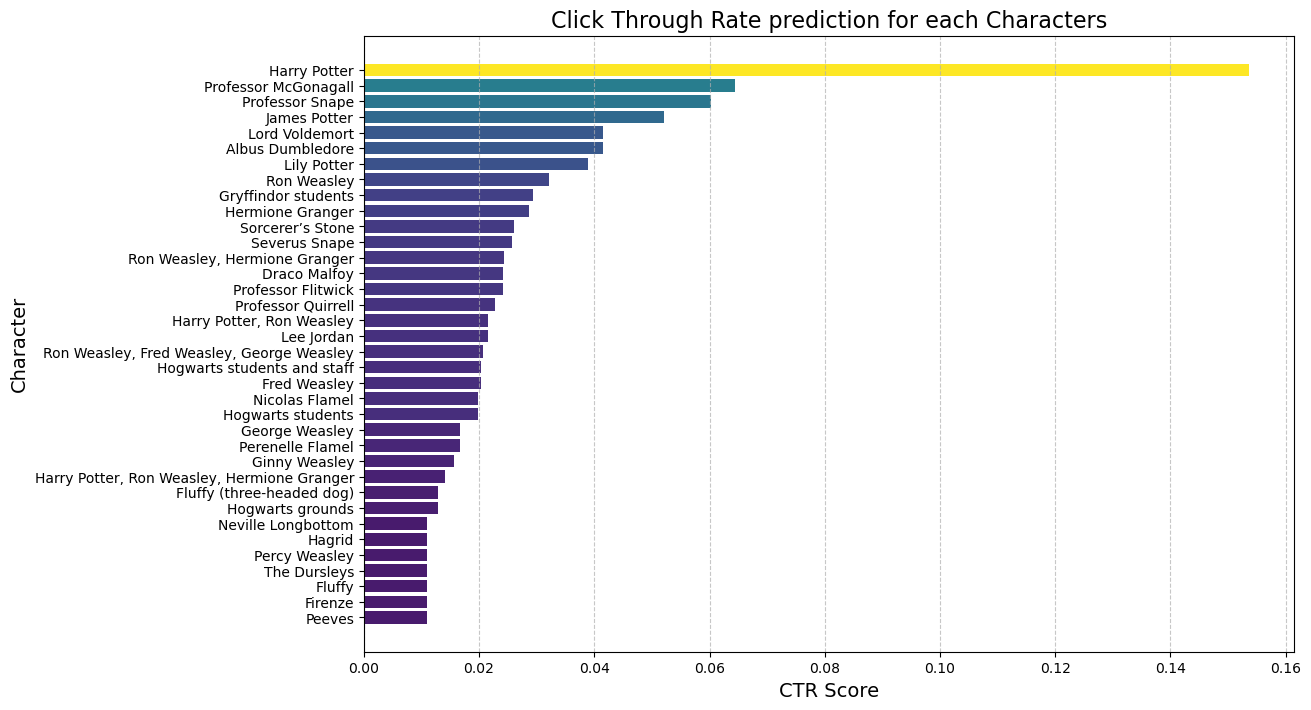
The visualization of predicted CTR scores confirmed that certain characters and events would likely attract significant attention, offering insights into how the book’s commercial appeal could be optimized.
4. Conclusion
Lab-3 successfully extended the work from Lab-1 and Lab-2 to predict the popularity of characters and events in Harry Potter and the Sorcerer’s Stone after commercialization. By analyzing character relationships and applying machine learning techniques for CTR prediction, this project provides valuable insights into how to optimize audience engagement based on narrative dynamics.
The CTR prediction model not only helps identify key characters but also provides a framework for analyzing the commercial potential of plot events, which could be applied to similar works in the future.