date: 2024-10-24
title: BDA-Survey
status: DONE
author:
  - AllenYGY
tags:
  - Survey
  - BDA
  - Project
publish: true
BDA-Survey
Overview
Our project can mainly be divided into 3 phrases. The first part is Data collection, and the second part is construct the casual graphical model, finally according to the casual graphical model we want to using 2 methods to estimate the final result, first one is base on casual evaluation and the second one is based on the traditional machine learning method.
Data Collection & Data Preprocessing
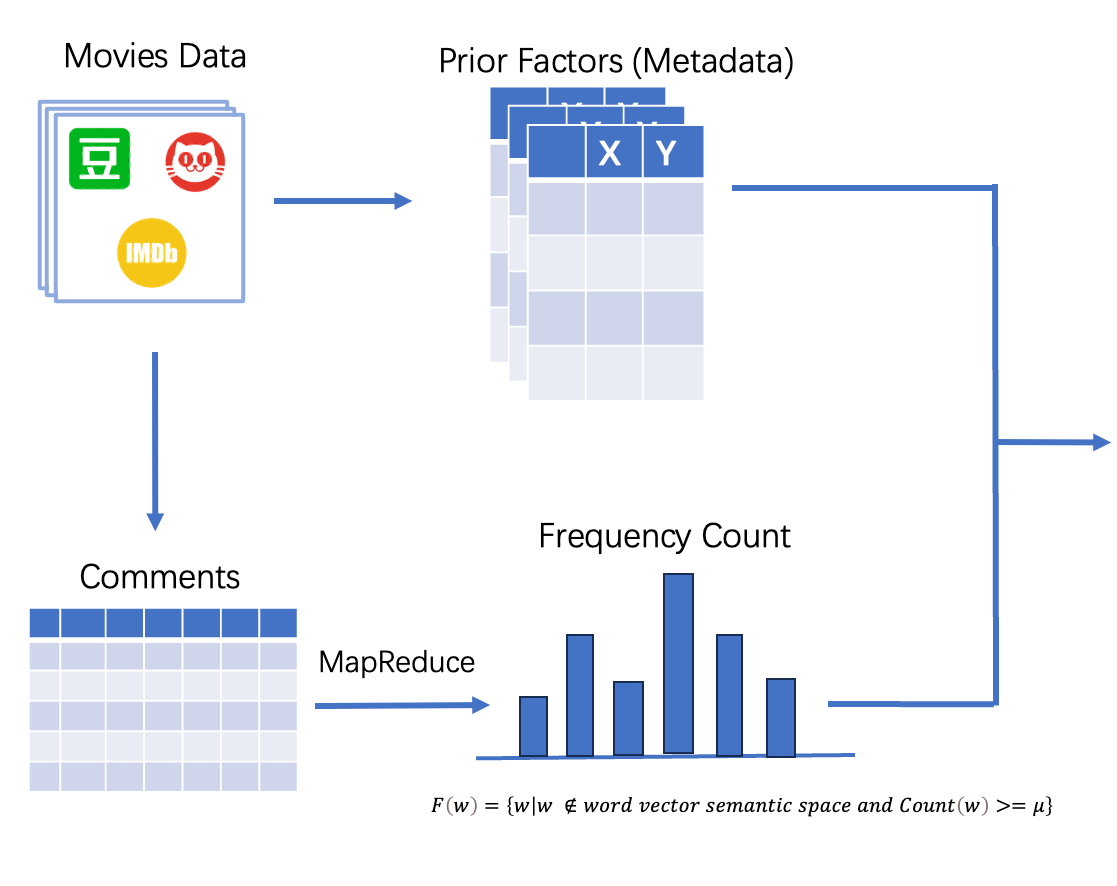
Our dataset would be collected from the movie comment website, such as Douban, Maoyan and IMDB. And we could divide our data into 2 parts, the first part is the movie information which is structured data, such as the budget, cast, genres, release date, and the second part is the movie comments which is unstructured data.
For structured data, we do not need to do much data preprocessing, but for unstructured data, we would need to do the following steps including: word segmentation, filter stop words including emotion bias words, statistical word frequency. Finally we get the high-frequency words and use them as the input of the casual graphical model.
High-frequency words are filtered through the upstream pre-trained word vector semantic space.
Construct Causal Graphical Model
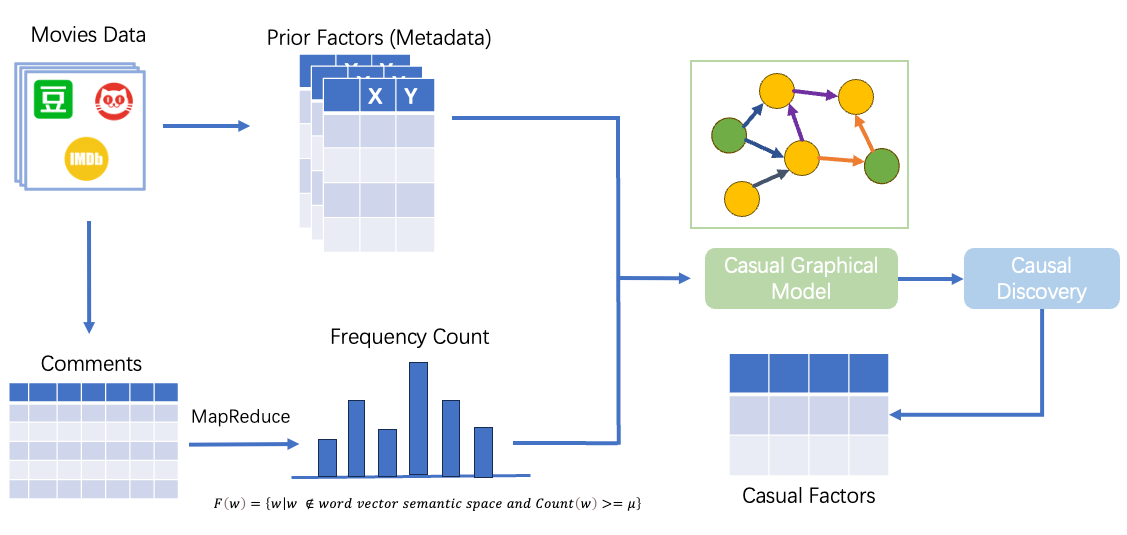
There are several methods to construct the casual graphical model, and we will try different methods to see which one is the best.
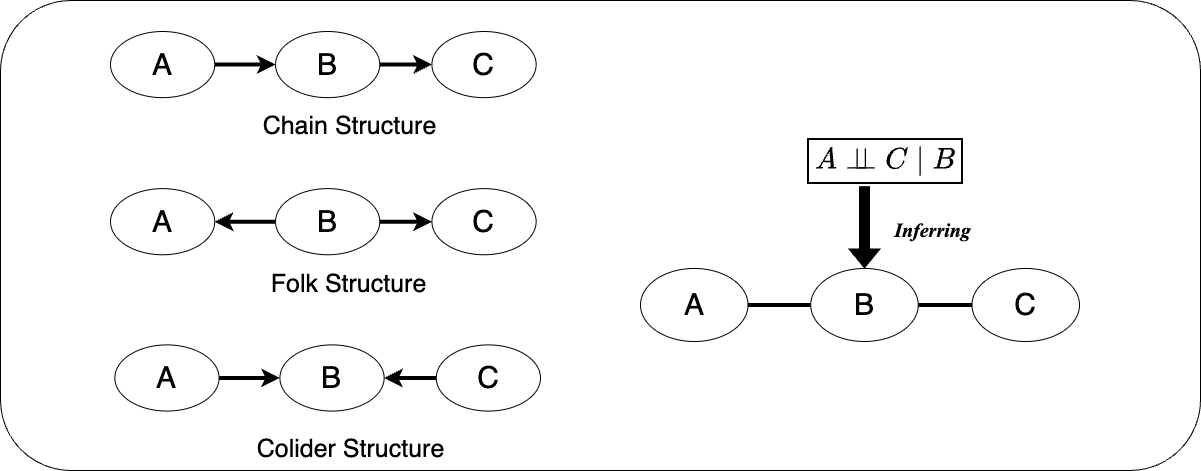
Constraint-based Causal Discovery Method
The constraints are based on the following conditions. For different V-structures, such as chain structure, folk structure and collider structure, they have different dependency properties, and the graph is built according to the dependency properties.
PC Algorithm
The algorithm begins by forming a complete undirected graph and eliminates edges based on unconditional independence. It then performs conditional independence tests, first using a single conditioning variable and then multiple conditioning variables. For each triple of variables
FCI Algorithm
The Fast Causal Inference (FCI) algorithm extends the PC algorithm by accounting for latent confounders and selection bias. It begins by forming a complete undirected graph and progressively removes edges based on unconditional and conditional independence tests. Like the PC algorithm, FCI identifies v-structures, where unconnected variables exhibit a conditional dependence that suggests a collider relationship. The algorithm then applies orientation propagation to direct additional edges. What sets FCI apart is its ability to handle latent variables by identifying bidirected edges that indicate confounding factors and selection bias arrows. The final output is a Maximal Ancestral Graph (MAG), which captures the causal relationships, latent confounders, and selection bias effects, providing a comprehensive view of the underlying causal structure.
Score-based Causal Discovery Method
The Greedy Equivalence Search (GES) algorithm begins with an empty graph and iteratively adds edges to improve the fit based on a score, such as BIC or a Z score from hypothesis testing. After each addition, the graph is mapped to its Markov equivalence class. Once no further edges improve the score, GES removes edges, if doing so increases the fit, until no further improvements can be made. Although more complex than the PC algorithm, GES and PC converge to the same Markov equivalence class with large samples, but may yield different results with finite data. There is no GES equivalent for handling unknown confounders.
Training Model & Evaluation
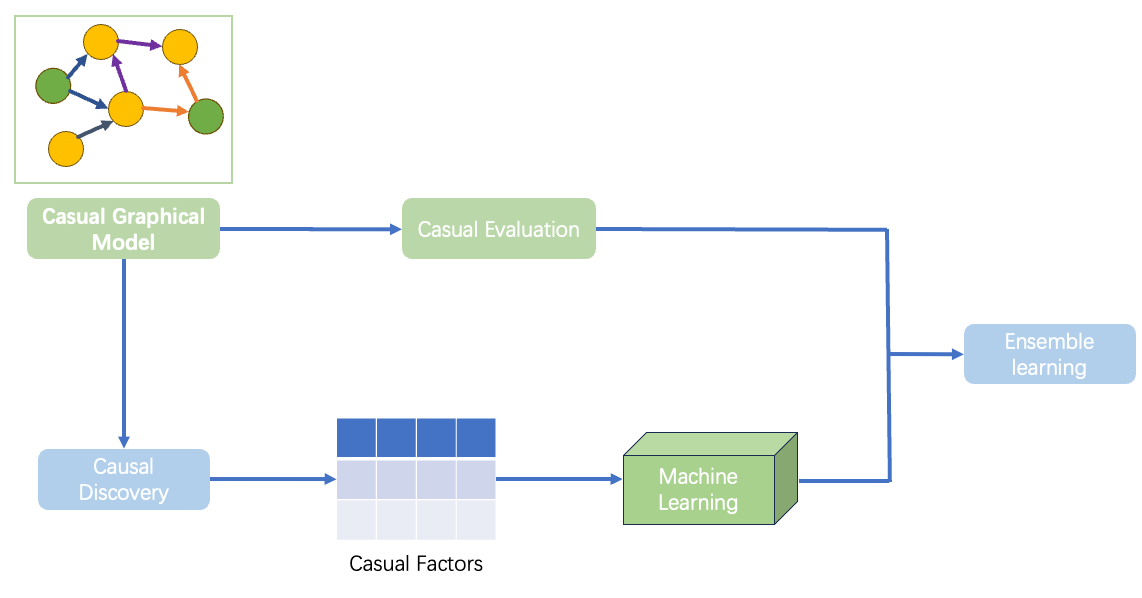
After constructing the causal graphical model, the next phase involves leveraging it to estimate the box office performance of movies. This will be done using two distinct methods: causal evaluation and traditional machine learning models. By comparing these two approaches, we aim to determine which method provides more accurate predictions and better insights into the causal relationships between variables.
Causal Inference-Based Evaluation
Using the constructed causal graphical model, we will employ causal inference techniques to evaluate the impact of different factors on box office success. Causal inference goes beyond correlation by identifying true cause-and-effect relationships, which can be highly valuable in decision-making, such as optimizing budgets, marketing strategies, or cast selection.
Steps:
- Intervention Analysis (Do-Calculus): This involves simulating interventions on key variables (e.g., increasing marketing budget, selecting a high-profile cast) to observe their direct impact on box office performance. By analyzing these interventions, we can make informed recommendations on which variables should be adjusted to improve outcomes.
- Counterfactual Analysis: After predicting the box office outcome, we can analyze what-if scenarios. For instance, “What if a different actor was cast?” or “What if the budget was reduced by 20%?” Counterfactuals help in understanding alternative outcomes under different conditions, providing deeper insights for decision-making.
- Identification of Confounding Factors: Using the causal graphical model, we can identify and address confounders—variables that might obscure the true relationships between the input features and the target (box office). This allows for more accurate predictions by isolating the true effects of variables.
Machine Learning-Based Evaluation
The second method involves building traditional machine learning models, such as linear regression, decision trees, random forests, and gradient boosting models. These models will predict box office performance based on the same data used to construct the causal model, including structured data (e.g., budget, release date) and features extracted from unstructured data (e.g., sentiment analysis from movie comments).
Steps:
-
Feature Engineering: For structured data, features such as budget, genres, and cast will be used directly. For unstructured data, sentiment analysis and topic modeling on movie reviews and comments will provide insights into audience perception, which can be highly predictive of box office performance.
-
Model Selection: Different machine learning algorithms will be tested and compared. These models will be trained on a portion of the data and validated using cross-validation techniques to ensure generalizability.
-
Evaluation Metrics: Both the causal inference model and the machine learning models will be evaluated using standard metrics, including: Mean Absolute Error (
These metrics will help in comparing the performance of the causal inference and traditional machine learning models.
Conclusion
The research in the field of movie box office prediction has integrated various data sources such as metadata, online comments, and social media, and employed various machine learning methods. With the development of causal inference and causal graphical models, box office prediction is no longer merely dependent on correlations between variables but can identify the true influencing factors through causal analysis. These studies provide more tools and methods for future movie box office predictions, aiding investors in making better decisions with limited resources.
Contribution
| Team Member | Contribution |
|---|---|
| 杨钧涯 | 30% |
| 王孟涵 | 30% |
| 肖嘉皓 | 20% |
| 葛欣一 | 20% |