date: 2024-10-19
title: "IELTS-Write-Task-1-Exercise"
status: UNFINISHED
author:
  - AllenYGY
tags:
  - NOTE
publish: True
IELTS-Write-Task-1-Exercise
Static chart
Exercise-1
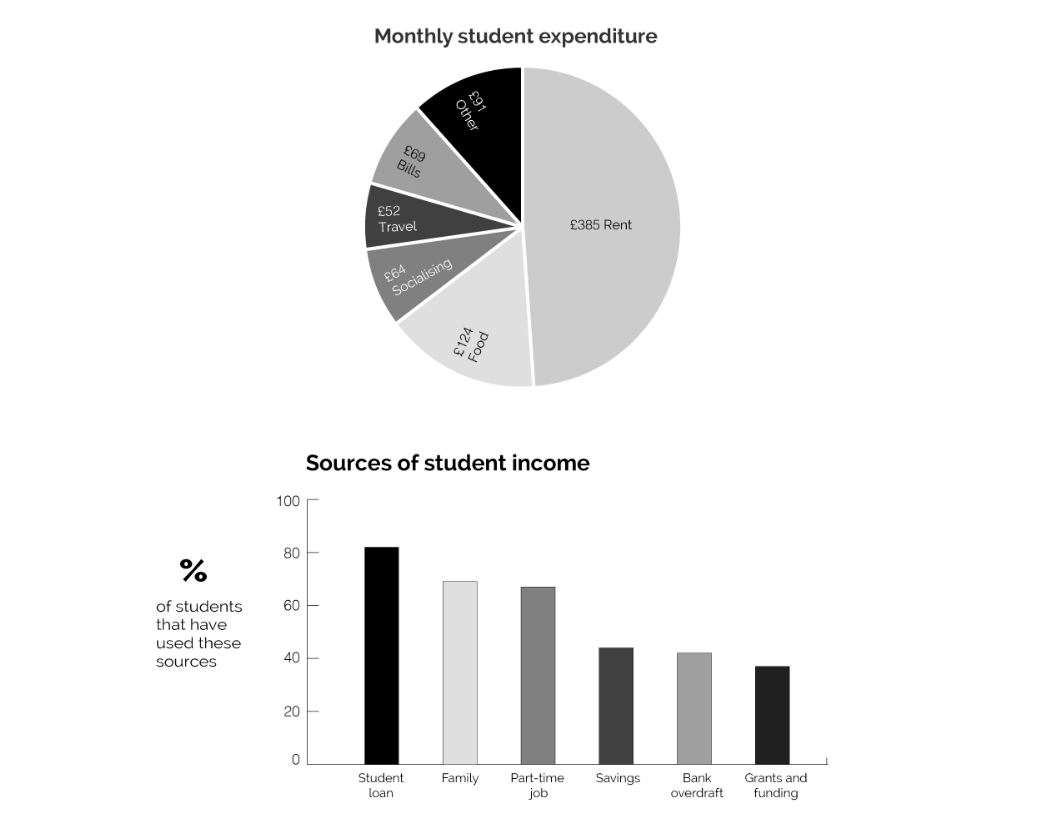
The pie chart shows average monthly student expenditure in the UK in 2016. The bar chart shows sources of student income in the same year.
Summarise the information by selecting and reporting the main features and make comparisons where relevant.
The 2 figures provided information about average monthly student expenditure and the sources of student income in the UK in 2o16.
The pie chart was consists of 6 parts, rent expenditure, food expenditure, socialising expenditure, travel expenditure, bills expenditure and other expenditure. And the rent expenditure predominated in the monthly student expenditure accounted for about 48 percentage. The second largest outcomes is food expenditure made up about 16 percentage. And the rest of parts of the expenditure almostly take the same proportions in the average monthly student expenditure. According to the bar chart, the sources of student income was made up with student loan, family, part-time job, savings, bank overdraft and grants and funding. The sources of student income could be divide into 3 parts. The first part is student loan which took up more than 80 percentages. And the second part accounted for more than 60 percentages which was consist of family and part-time job. And the last part was mainly made up by savings, bank overdraft and grants and funding accounted for about 40 percentage.
The two figures provide information about average monthly student expenditure and the sources of student income in the UK in 2016. The pie chart shows the breakdown of student spending, while the bar chart illustrates different income sources for students.
The pie chart is divided into six categories: rent, food, socializing, travel, bills, and other expenses. Rent dominates student expenditure, accounting for approximately 48%. The second-largest expense is food, which makes up about 16%. The remaining categories — socializing, travel, bills, and other expenses — each take up a smaller and fairly similar proportion of the total, ranging between 6% and 12%.
The bar chart shows that student income is sourced from six main categories: student loans, family, part-time jobs, savings, bank overdrafts, and grants or funding. Student loans represent the largest source of income, used by over 80% of students. Family contributions and part-time jobs are the next most significant sources, each accounting for over 60%. The remaining sources, including savings, bank overdrafts, and grants or funding, contribute to around 40% or less.
In summary, rent is the most significant student expenditure, while student loans are the primary source of income, with family support and part-time jobs also playing a considerable role.