date: 2024-10-15
title: "IELTS-Write-Task-1-Material"
status: DONE
author:
  - AllenYGY
tags:
  - NOTE
publish: True
IELTS-Write-Task-1-Material
Describing Increases and Decreases
| Increase | Decrease |
|---|---|
| rise / rose | fall / fell |
| increase / increased | decline / declined |
| grow / grew | drop / dropped |
| surge / surged | plummet / plummeted |
| climb / climbed | dip / dipped |
| escalate / escalated | reduce / reduced |
“Sales increased from $1 million to $2 million over the year.”
Rise/ Rose from A to B between C and D
increase/ increased
grow/grew
climb/climbed
escalate/escalated
Sth surged to <> in ...
“Sales surged to $2 million in the first quarter.”
Fall/Fell from A to B by the end of the decade
Decline/Declined
Drop / Dropped
Dip / Dipped
sth plummeted to <> in ...
“The stock price plummeted to its lowest point in March 2021.”
Adverbs for Emphasis
- For Big Changes: significantly, dramatically, considerably, substantially
- Example: "The number of users increased significantly over the period."
- For Small Changes: slightly, gradually, moderately, marginally
- Example: "The sales rose slightly in the first quarter."
Describing No Change
-
Remain Stable/Constant
- [Something] remained stable/constant at [number/level] over [time period].
- Example: “The temperature remained constant at 20°C over the winter months.”
-
Stay the Same
- [Something] stayed the same at [number/level] throughout [time period].
- Example: “Production stayed the same at 1,000 units per month over the two-year period.”
-
Maintain the Same Level
- [Something] maintained the same level of [number/amount] for [time period].
- Example: “The population maintained the same level of 5 million for over a decade.”
-
Stabilize At
- [Something] stabilized at [number/level] by [specific time].
- Example: “Visitor numbers stabilized at 50,000 per month by the end of the summer.”
Describing Trends and Patterns Over Time
- Upward Trends: upward trend, steady rise, growth, upward movement
- Example: "There was a steady rise in sales from 2015 to 2020."
- Downward Trends: downward trend, gradual decline, decreasing trend, downward movement
- Example: "The data shows a gradual decline in population."
Describing Highs and Lows
-
Peak / Peaked At
- [Something] peaked at [highest number/level] in [time period].
- Example: “The number of online shoppers peaked at 2 million in December.”
- [Something] peaked at [number] before declining.
- Example: “Tourist arrivals peaked at 100,000 before declining in the following months.”
-
Reach a Peak of
- [Something] reached a peak of [highest number] in [time period].
- Example: “The company’s profits reached a peak of $5 million in 2019.”
- [Something] reached a peak of [number] and then [verb]
- Example: “The temperature reached a peak of 40°C and then fell gradually.”
-
Hit a Low of / Lowest Point
- [Something] hit a low of [lowest number] in [time period].
- Example: “Unemployment hit a low of 3% in April.”
- [Something] reached its lowest point at [number].
- Example: “The stock price reached its lowest point at $30 per share.”
-
Bottom Out
- [Something] bottomed out at [lowest number] in [time period].
- Example: “Sales bottomed out at 20,000 units in March before starting to recover.”
- After a sharp decline, [something] bottomed out at [number].
- Example: “The market bottomed out at 50 points after a sharp decline.”
Describing Fluctuations
-
Fluctuate / Fluctuation
- [Something] fluctuated between [number A] and [number B] over [time period].
- Example: “The number of visitors fluctuated between 10,000 and 20,000 throughout the year.”
- There was a fluctuation in [something] from [number A] to [number B] over [time period].
- Example: “There was a fluctuation in stock prices from $100 to $150 over the course of the month.”
- Fluctuations were observed in both A and B, with A ranging between X and Y, and B between M and N.
-
Vary / Variation
- [Something] varied significantly, ranging from [number A] to [number B].
- Example: “The temperature varied significantly, ranging from 5°C to 25°C in spring.”
- There was a noticeable variation in [something] from [number A] to [number B] over [time period].
- Example: “There was a noticeable variation in electricity consumption from 500 kWh to 1,200 kWh each month.”
-
Oscillate
- [Something] oscillated between [number A] and [number B] over [time period].
- Example: “The water level oscillated between 50 meters and 75 meters during the rainy season.”
- [Something] oscillated around [number], reaching highs of [number A] and lows of [number B].
- Example: “The temperature oscillated around 20°C, reaching highs of 30°C and lows of 10°C.”
-
Undulate (more formal)
- [Something] undulated, moving up and down between [number A] and [number B] over [time period].
- Example: “The coastline undulated, moving up and down between 100 and 200 meters in width along different sections.”
- [Something] showed an undulating pattern, with peaks at [number A] and troughs at [number B].
- Example: “The river flow showed an undulating pattern, with peaks at 500 cubic meters per second and troughs at 100 cubic meters per second.”
Making Comparisons
- Comparative Adjectives: higher than, lower than, more significant, less than, greater, fewer
- Example: "The sales in 2019 were higher than those in 2018."
- Superlative Adjectives: the highest, the lowest, the most significant, the least
- Example: "June experienced the highest levels of rainfall."
Time Phrases
- For specific times: in 2010, between 2005 and 2010, during the period, over the years
- Example: "Sales rose between 2005 and 2010."
- For trends over time: over the next decade, in the following years, over the period of time
- Example: "Over the next decade, there was a steady increase in demand."
Connecting Phrases
- Adding Information: furthermore, additionally, moreover
- Example: "Additionally, the number of students enrolling continued to rise."
- Contrasting Information: however, in contrast, on the other hand
- Example: "In contrast, the number of unemployed people decreased slightly."
- Cause and Effect: as a result, therefore, consequently
- Example: "As a result, the overall figures rose sharply."
Bar Charts
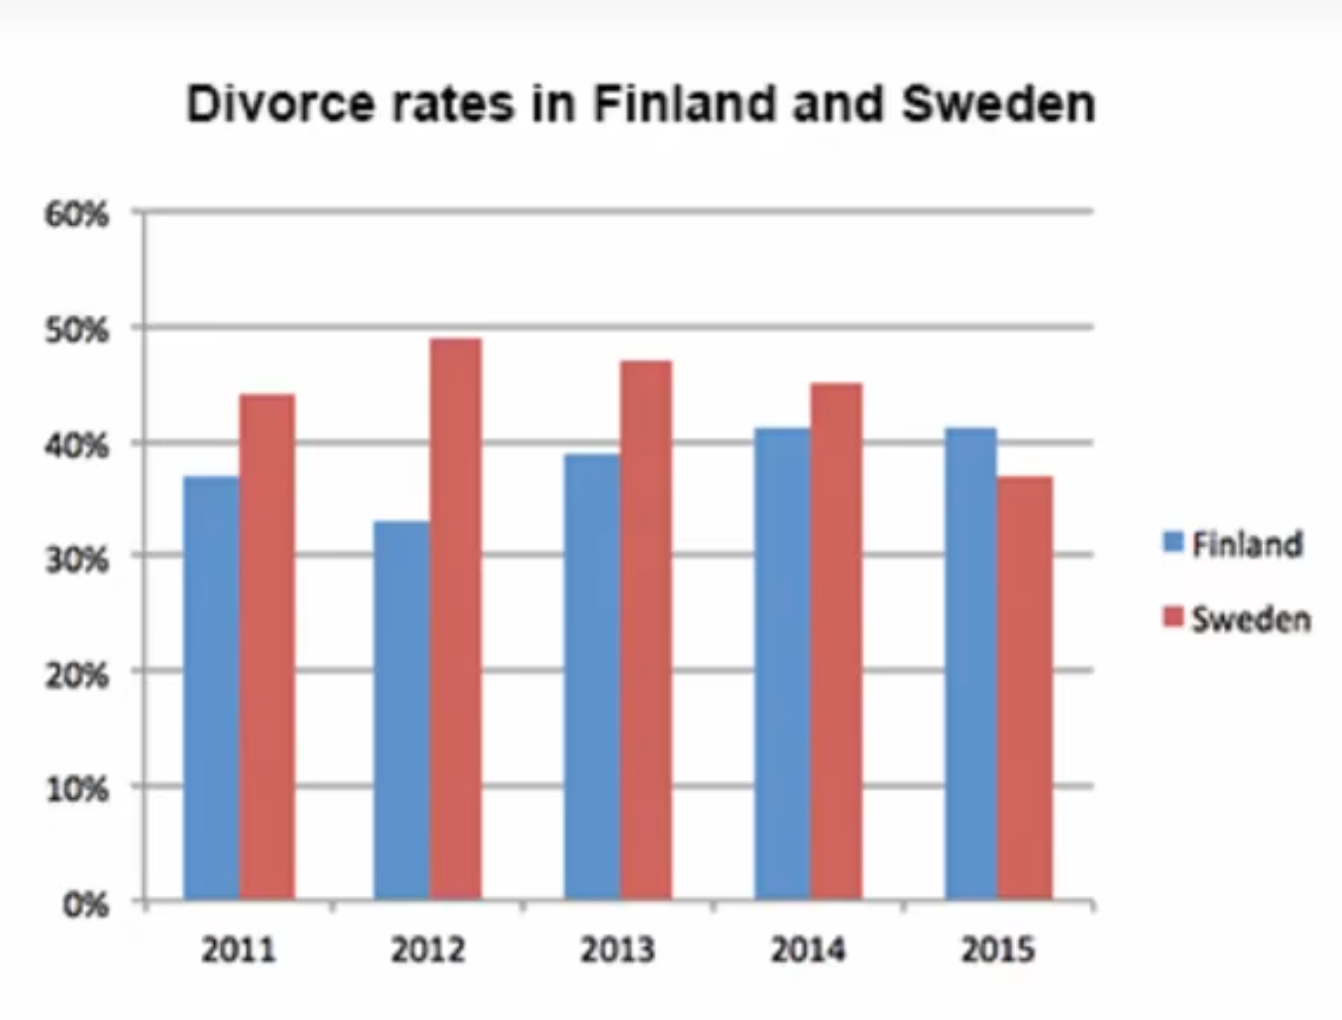
The bar chart shows the divorce rates in two European countries from 2011 to 2015.
Summarize the information by selecting and reporting the main features and make comparisons where relevant.
Introduction
The bar chart provides information about the percentages of divorces in Finland and Sweden between 2011 and 2015.
shows = provides information about = represents = illustrates
Overview
Major Trends / General information
Overall, Sweden experienced a downward trend, while Finland showed an upward trend throughout the period. Both countries' divorce rates had some fluctuations. Although Finland initially had a lower rate, it outraced Sweden at the end of the period.
Feature 1
Sweden's divorce rate was about 45% in 2011, being higher than Finland's rate by approximately 8%. Then, it rose to almost fifty percent in 2012. However, the figure showed a gradual decrease to about 47% 2013, and continued to decline steadily to the end of the period, reaching around 45% in 2014 and hitting a low-point of about 37% in 2015.
hitting a low-point of x%
Feature 2
Percentages of divorces in Finland was less than 40% in 2011, and it decreased in 2012, when about one third of marriages in Finland ended with a divorce (as opposed to almost a half in Sweden). However, the figure experienced a steady growth during the next 2 years.
It rose to approximately 39% in 2013, then increased by around 3% in 2014, and remained steady for the next year, outracing the rate of Sweden.