date: 2024-12-24
title: ML-K means
status: DONE
author:
  - AllenYGY
tags:
  - NOTE
  - K-Means
  - ML
  - Clustering
publish: True
ML-K means
Process
- 初始化簇中心 (Initialize Cluster Centers):
- 随机选择 K 个数据点作为初始聚类中心(也叫质心)。
- 分配簇 (Assign Clusters):
- 对每个数据点,根据其与各个簇中心的距离,分配到距离最近的簇。
- 更新簇中心 (Update Centroids):
- 对每个簇,计算所有属于该簇数据点的平均值,将其作为新的簇中心。
- 重复迭代 (Iterate Until Convergence):
- 重复步骤 2 和步骤 3,直到簇分配不再变化或达到最大迭代次数。
- 评估结果 (Evaluate Results):
- 使用目标函数(如簇内方差)评估聚类结果的质量。
- 可视化数据分布,检查聚类效果。
Strengths of k means
Simple: easy to understand and to implement
Efficient: Time complexity: O(tkn),
- where n is the number of data points,
- k is the number of clusters, and
- t is the number of iterations.
Since both k and t are small. k-means is considered a linear algorithm.
K-means is the most popular clustering algorithm.
Note that: it terminates at a local optimum if SSE (Sum of Square Error) is used. The global optimum is hard to find due to its complexity.
Weaknesses of k-means
The algorithm is only applicable if the mean is defined.
- For categorical data, k-mode - the centroid is represented by most frequent values.
The user needs to specify k.
The algorithm is sensitive to outliers - Outliers are data points that are very far away from other data points.
- Outliers could be errors in the data recording or some special data points with very different values.
The algorithm is sensitive to initial seeds.
The k-means algorithm is not suitable for discovering clusters that are not hyper-ellipsoids (or hyper-spheres).
Weaknesses of k-means: To deal with outliers
One method is to remove some data points in the clustering process that are much further away from the centroids than other data points.
Another method is to perform random sampling. Since in sampling we only choose a small subset of the data points, the chance of selecting an outlier is very small.
- Assign the rest of the data points to the clusters by distance or similarity comparison, or classification
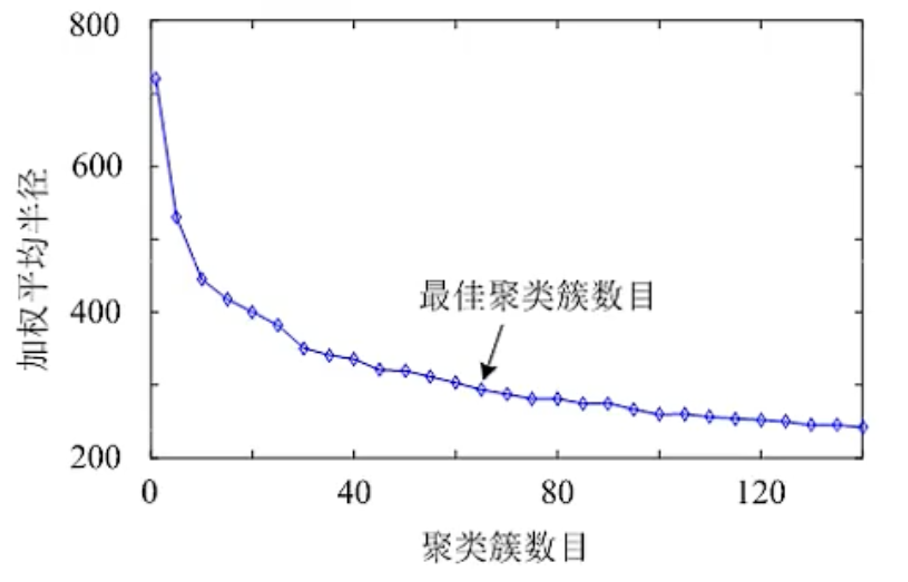
K-Choice
类中心初始化
- 大于最小间距的随机点/样本点
- K个相互距离最远的样本点
- K个等距网格点
Common ways to represent clusters
Use the centroid of each cluster to represent the cluster.
- Compute the radius and standard deviation of the cluster to determine its spread in each dimension.
- The centroid representation alone works well if the clusters are of hyper-spherical shape.
- If clusters are elongated or are of other shapes, centroids are not sufficient.
Using classification model
- All the data points in a cluster are regarded to have the same class label, e.g., the cluster ID.
- Run a supervised learning algorithm on the data to find a classification model.
Use frequent values to represent cluster
- This method is mainly for the clustering of categorical data (e.g., k-mode clustering).
- The primary method used in text clustering is where a small set of frequent words in each cluster is selected to represent the cluster.
Clusters of arbitrary shapes
- Hyper-elliptical and hyper-spherical clusters are usually easy to represent, using their centroid together with spreads.
- Irregular shape clusters are hard to represent. They may not be useful in some applications.
- Using centroids are not suitable (upper figure) in general
- K-means clusters may be more useful (lower figure), e.g., for making 2 size T-shirts.
Example
Given a set of 5 samples:
Try the k-means clustering algorithm to cluster the samples into 2 classes.
Consider Data point:
| Data Point | Distance to |
Distance to |
Cluster |
|---|---|---|---|
| (0, 2) | 2 | (0,0) | |
| (0, 0) | 0 | 5 | (0,0) |
| (1, 0) | 1 | 4 | (0,0) |
| (5, 0) | 5 | 0 | (5,0) |
| (5, 2) | 2 | (5,0) |
| Data Point | Distance to |
Distance to |
Cluster |
|---|---|---|---|
| (0, 2) | (0,0) | ||
| (0, 0) | (0,0) | ||
| (1, 0) | (0,0) | ||
| (5, 0) | 1 | (5,0) | |
| (5, 2) | 1 | (5,0) |
The cluster does not change after the second iteration. The final cluster assignments are:
Class-1:
Class-2: